How It Works | KPIs
Define what success looks like.The platform builds the metric.
Creating a KPI usually means an analyst and a queue. In Chainworthy you describe the metric, confirm the AI proposal, and link it to a goal. Charts and Findings follow automatically.
Features
Plain-language creation
Describe it. Confirm it.
Describe what to measure. Chainworthy proposes formula, aggregation, and chart type. Refine in conversation if needed.
Goal-linked by design
Tied to what you are chasing.
Attach KPIs to goals. Mark one as primary so goal progress always reflects the metric that matters.
Findings, not just charts
Tabbed analysis on every KPI.
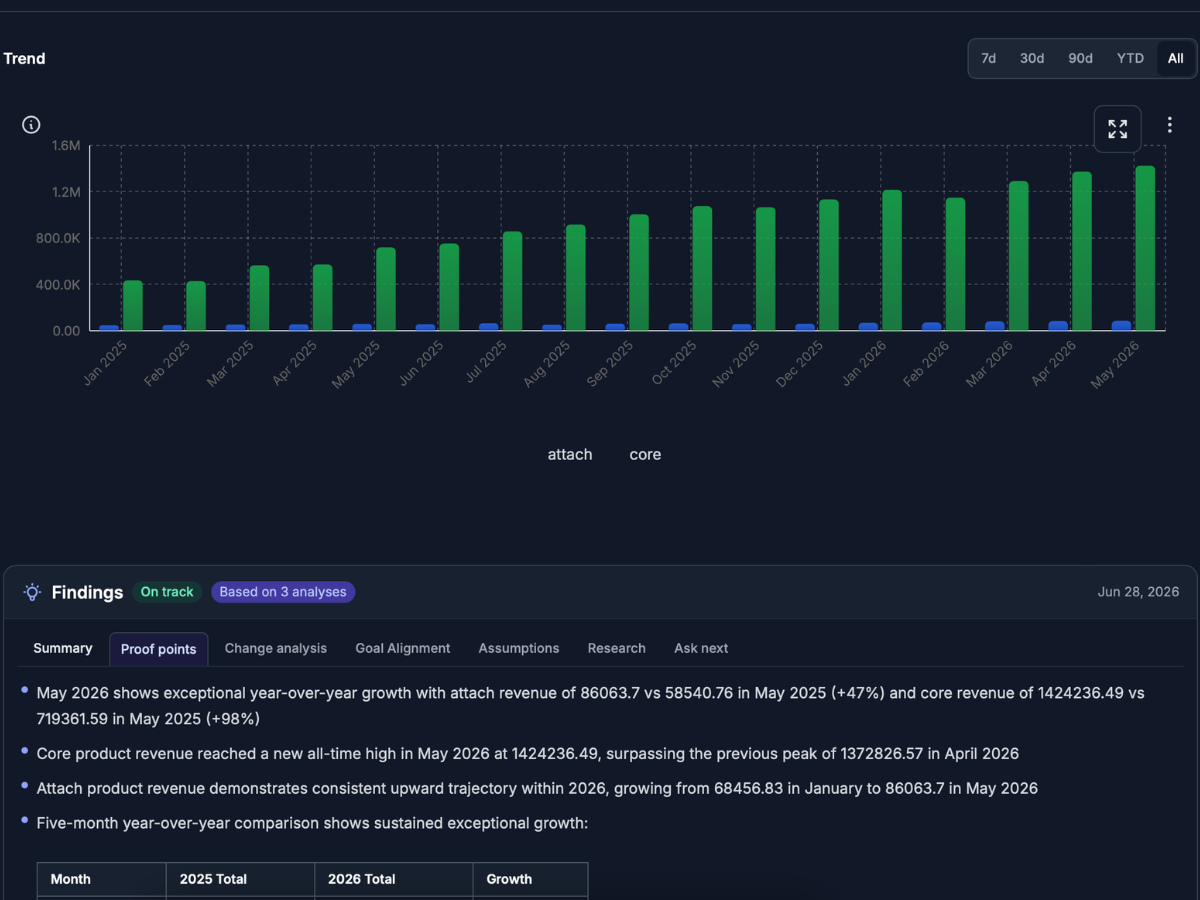
Each KPI includes tabbed Findings: Summary, Proof points, Change analysis, Goal Alignment, Assumptions, Research, and Ask next.
Projections where supported
When the data allows.
See projected trajectories where your data supports them. Assumptions stay visible.
Updates when data lands
No manual refresh.
New uploads recalculate KPI results. Goal progress on the canvas updates without rebuilding reports.
How KPIs fit the loop
- KPIs connect goals to data.
- Recommendations draw on KPI results and Findings.
- The weekly goal briefing references primary KPI movement.
Build KPIs without a data team
Request a demo to see KPI creation from plain-language description to chart and Findings.